Are the motoneurons like those involved in swimming, for example, by a zebra fish, recruited in a graded manner? Yup
Then, are the active set of spinal interneurons graded during increases in swimming speed? NOPE!!!!
A fascinating study by Fetcho, McLean, and colleagues (2008), entitled “Continuous Shifts in the Active Set of Spinal Interneurons during Changes in Locomotor Speed” found these finding in the larval zebra fish. Instead of repeating what they wrote, here are some intriguing figures:
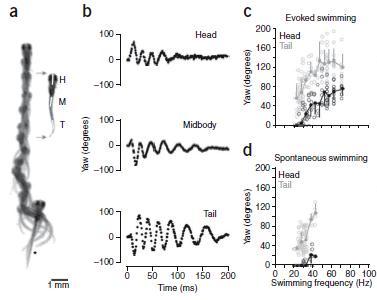
Figure 1, Parts a – d. Gradation of movement. These parts of Figure 1 show slow swimming in a; movement around vertical axis (i.e., yaw) for head, midbody, and tail in b; yaw for evoked swimming in c; and yaw for spontaneous swimming in d. Parts c and d demonstrate that “fish can smoothly grade between the fastest and the slowest swimming movements without any obvious discontinuity in the axial bending pattern.”

Figure 1 a-d. Analysis of real and fictive evoked swimming movements. (a) Consecutive overlapping images of a bout of swimming elicited by a tactile stimulus to the tail (at asterisk). A frame extracted from the montage (gray arrows) shows the regions selected for kinematic analysis at the head (H), midbody (M) and tail (T). Images were captured at 1,000 Hz (images 1–9, every 4 ms; 10–12, 8 ms; 13–14, 16 ms; 15–18, 32 ms). (b) Automated analysis of yaw at three points along the body, from the bout in a. Only the tail showed any noticeable movement at the end of the bout, when swimming was slowest. (c) Plots of head and tail yaw from 12 evoked swimming bouts in 12 larvae. The degree of head and tail yaw decreased as a function of swimming frequency. Open circles are raw data points, whereas closed circles represent means (± s.d.) from data binned at 5-Hz intervals (for example, 15–20, 20–25, etc.). (d) A similar plot for spontaneous bouts of swimming (12 from the same 12 larvae), whose values are comparable to the lower end of evoked swimming frequencies. Only the first episode of the five analyzed in each fish is shown in c and d.
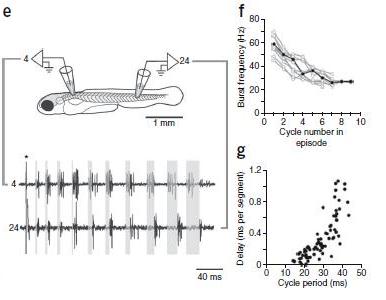
Next, Figure 1, Parts e – g. Grading of motor pattern. In these parts of Figure 1, part e shows how fictive swimming was recorded, part f graphs the change in bursts versus swimming frequency, and part g illustrates the increase in longitutinal delay as swimming frequency decreased, i.e., as cycle period increased. The investigators concluded that, “These data indicate that the motor pattern, similar to the movements, can be smoothly graded from fast to slow frequencies.”

Figure 1 e-g. (e) Fictive swimming activity recorded from motor nerves along the same side of the body (4th and 24th muscle cleft on the left side), whose location is illustrated schematically. A brief electrical stimulus (artifact at asterisk) was used to elicit swimming activity. Shaded gray boxes from the start of the burst in the rostral segment to the start of the caudal burst in the same cycle demonstrate the gradual increase in longitudinal delay associated with a smooth decrease in swimming frequency. (f) Plot of motor nerve burst frequency (measured from the tail) with respect to the cycle in a bout, from ten bouts in ten larvae. (g) Plot of longitudinal delay with respect to cycle period, from the same ten bouts as in f.
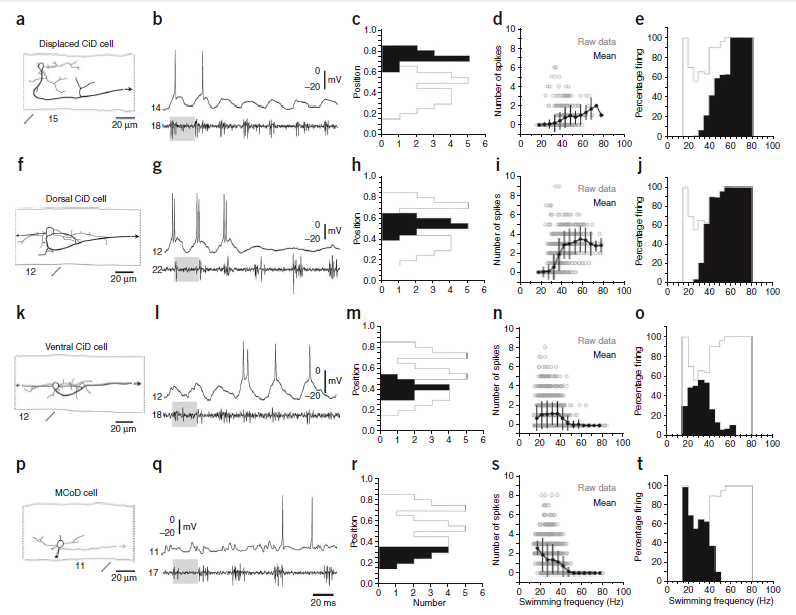
And now for the attention getting finding. McLean et al. divided the excitatory interneurons into four groups: 1) multipolar commissural descending interneurons (MCoD) cells,2) circumferential descending interneurons (CiD) cells that were silenced at higher swimming speeds, 3) CiDs in the main population in which silencing was not as evident on visual inspection and 4) the most dorsal CiDs, which were displaced from the main population. Figure 8 summarizes the data for their four groups of spinal interneurons. They stated that, “during evoked swimming, the most dorsal groups of CiDs were active initially at the highest frequencies, when more ventral CiDs and the MCoDs were not firing (Fig. 8a,b,f,g). As the frequency slowed, the dorsal neurons went silent and the more ventral CiDs began to fire (Fig. 8k,l). The probability of these ventral CiDs firing dropped at the lowest frequencies, when the MCoDs were engaged (Fig. 8p,q).” [Formatting added for emphasis]
Note, some of the interneurons were not firing, or went silent, or the firing dropped when other interneurons were active. Amazing!
Okay, even more intriguing findings. In Figure 8, parts d, i, n, and s shows the dorso-ventral position of the neurons. Please notice the MCoD cells, active at slow speed, had the most ventral, and the dorsal CID cells, active at the highest speed, were more dorsal. The investigators wrote, “Notably, histograms of the percentage of the cycles at each frequency in which a neuron fired at least once showed that the MCoD neurons were most active at the lowest frequencies (part t), followed by the most ventral portion of the CiD population (part o), the CiDs just dorsal to them (part j) and finally the displaced CiDs, as the frequency of swimming increased (part e). In CiDs and across the MCoD/CiD populations, the probability of firing of ventral cells active at low swimming frequencies dropped at higher frequencies as new sets of neurons were recruited.
Here note that the active set of spinal interneurons was not hapharardly located but was arranged in a distinct ventral to dorsal physical gradient. Very, very interesting!

Figure 8. Frequency-dependent shifts in recruitment in and between classes. (a–e) Data from displaced, dorsally located CiD cells, the most dorsal of the CiDs, are organized according to morphology (a), physiology (b), dorso-ventral soma position (c), number of spikes during swimming at different frequencies (d) and reliability of firing during swimming at different frequencies (e). Black arrows indicate continuation of the axon (a). Segment locations are noted below the images. Gray shaded boxes indicate similar swimming frequencies (b). Segmental recording locations are noted to the left of the trace. The gray outlines in c and e indicate the maximum values of the histogram that would be obtained if those for the individual groups of neurons were overlaid. Open circles are raw data points and closed circles represent means (± s.d.) from data binned at 5-Hz intervals, using the nerve recording as a frequency reference (d). The number of cycles in which a cell fired is expressed as a percentage of the total number of cycles at that frequency (e). Plots are derived from 127 bouts from 12 cells in 12 larvae. (f–j) Data from dorsally located, nondisplaced CiD cells are organized as detailed in a–e Plots are derived from 268 bouts from 14 cells in 14 larvae. (k–o) Data from more ventrally located CiD cells are organized as detailed in a–e. Plots are derived from 398 bouts from 11 cells in 11 larvae. (p–t) Data from MCoD cells are organized as detailed in a–e. The asterisk indicates where the axon crossed cord and then descended. The plot in s is shown in Figure 5d. As the frequency of swimming increased, the active set of cells shifted from the ventral MCoDs and CiDs to the dorsal CiDs, as seen most easily by a comparison of the positions (black bars superimposed on the whole population outlined in gray in c, h, m and r) with the frequencies over which they are active (black in e, j, o and t).
In fact, McLean et al. (2008) replicated an earlier study, entitled “A Topographic Map of Recruitment in Spinal Cord” (McLean et al., 2007). “Ventral motor neurons and excitatory interneurons are rhythmically active at the lowest swimming frequencies, with increasingly more dorsal excitatory neurons engaged as swimming frequency rises. Inhibitory interneurons follow the opposite pattern.”
LOOK AT THEIR NEXT STUDY, (McLean and Fetcho, 2009); their title says it all: “Spinal Interneurons Differentiate Sequentially from Those Driving the Fastest Swimming Movements in Larval Zebrafish to Those Driving the Slowest Ones“. They “conclude that a simple principle governs the development of spinal networks in which the neurons driving the fastest, most powerful swimming in larvae develop first with ones that drive increasingly weaker and slower larval movements layered on over time. Because the neurons are arranged by time of differentiation in the spinal cord, the result is a topographic map that represents the speed/strength of movements at which neurons are recruited and the temporal emergence of networks.” [Formatting added for emphasis]
For the ‘picky’ scientist, the zebra fish interneurons in the above papers were not related to vertebrate expression patterns based on transmission factors. Kiehn (2011) has provided a table that relates the mouse transcription-factor-defined subclasses to fish/tadpole subclasses. Thus the zebra fish MCoD interneuron corresponds to the mouse V0 interneuron and the zebra fish CID interneuron corresponds to the mouse V2a interneuron.
Finally, Fetcho and McLean (2010) have published a review of their recent articles, entitled: ” Some principles of organization of spinal neurons underlying locomotion in zebrafish and their implications.” They are the following:
Principle 1: Broad neuronal classes defined by a set of transcription factors, key morphological features, and transmitter phenotypes arise in an orderly way from different dorso-ventral zones in spinal cord. This core pattern appears to lie at the developmental and phylogenetic base of the construction of spinal networks in all vertebrates. Neurons arising from the zones that define the basic ground plan diversify further in their morphological and functional details to give rise to specialized cell types during development and evolution.
Principle 2: Motor behaviors and both motoneurons and interneurons differentiate in order from gross, often faster, movements and the neurons driving them to progressively slower movements and their underlying neurons. Gross movements such as escape-like bends and whole body swimming movements and the neurons producing them develop first, with slower movements and the neurons underlying them differentiating later.
Principle 3: Recruitment order of motoneurons and interneurons is based upon time of differentiation. In zebrafish, one consequence of principle 2 is a topographic map of neuronal recruitment in cord that arises because the neurons remain arranged in the spinal cord largely by the time at which they differentiated.
Principle 4: Different locomotor speeds involve some shifts in the set of active interneurons. Some interneurons active at slow speeds are silenced at faster ones and this pattern occurs both within and between excitatory classes. Thus, the interneurons behave differently from the motoneurons with respect to recruitment because the motoneurons only add neurons to the active pool as speed increases, while the interneurons add new ones while removing others that were active at slower speeds. The networks for slow and fast swimming are not the same and appear to constantly shift as speed increases.
Does the active set of interneurons continuously shifting with changes in speed just for the zebra fish or for all vertebrates?
- Grillner and Jessell (2009): ”An impressively detailed analysis of the recruitment pattern of ventral interneurons and motor neurons in zebrafish provides evidence for the presence of speed-selective interneuronal circuits. … Not too shabby indeed.”
- Kiehn (2011): “What these findings signify … is that the configuration or the organization of the network generating rhythmic activity may change in a state-dependent or task-dependent manner.”
- Hill et al. (2012): “…these zebrafish spinal interneurons appear to be hard-wired to always burst at the beginning or at the end of the escape motor program [35]. This is in contrast to the unreliably bursting neurons in the T. diomedea swim network, which vary their participation from swim cycle-to-cycle, and from episode-to-episode (Fig. 8).”
Take home: Graded recruitment of motoneurons continues to be a universal phenomenon, and the active set of interneurons, however, continuously shifts with changes in speed for the zebra fish and perhaps as a general principle for all vertebrates.
Next post: What about walking and running? Patterns of muscle activity, Muscle Synergies and Timing Generation Networks, and motor control programs for walking and running will be discussed using the ‘flashlight’ of the active sets of spinal interneurons involved.
References
Fetcho JR, McLean DL. Some principles of organization of spinal neurons underlying locomotion in zebrafish and their implications. Ann. N.Y. Acad. Sci. 1198: 94–104 (2010).
Grillner S, Jessell T. Measured Motion: Searching for simplicity in spinal locomotor networks. Curr. Opin. Neurobiol. 19: 572–586. doi:10.1016/j.conb.2009.10.011 (2009).
Hill ES, Vasireddi SK, Bruno AM, Wang J, Frost WN. Variable Neuronal Participation in Stereotypic Motor Programs. PLoS ONE 7: e40579. doi:10.1371/journal.pone.0040579 (2012).
Kiehn O. Development and functional organization of spinal locomotor circuits. Curr. Opin. Neurobiol. 21: 100–109 (2011)
McLean HL, Fan J, Higashijim S, Hale ME, Fetcho JR. A topographic map of recruitment in spinal cord. Nature 446: 71–75 (2007).
McLean HL, Masino MA, Koh IYY, Lindquist WB, Fetcho JR, Continuous shifts in the active set of spinal interneurons during changes in locomotor speed. Nat. Neurosci. 11: 1419–1429 (2008).
McLean, DL, Fetcho JR. Spinal interneurons differentiate sequentially from those driving the fastest swimming movements in larval zebrafish to those driving the slowest ones. J. Neurosci. 29: 13566–13577 (2009).